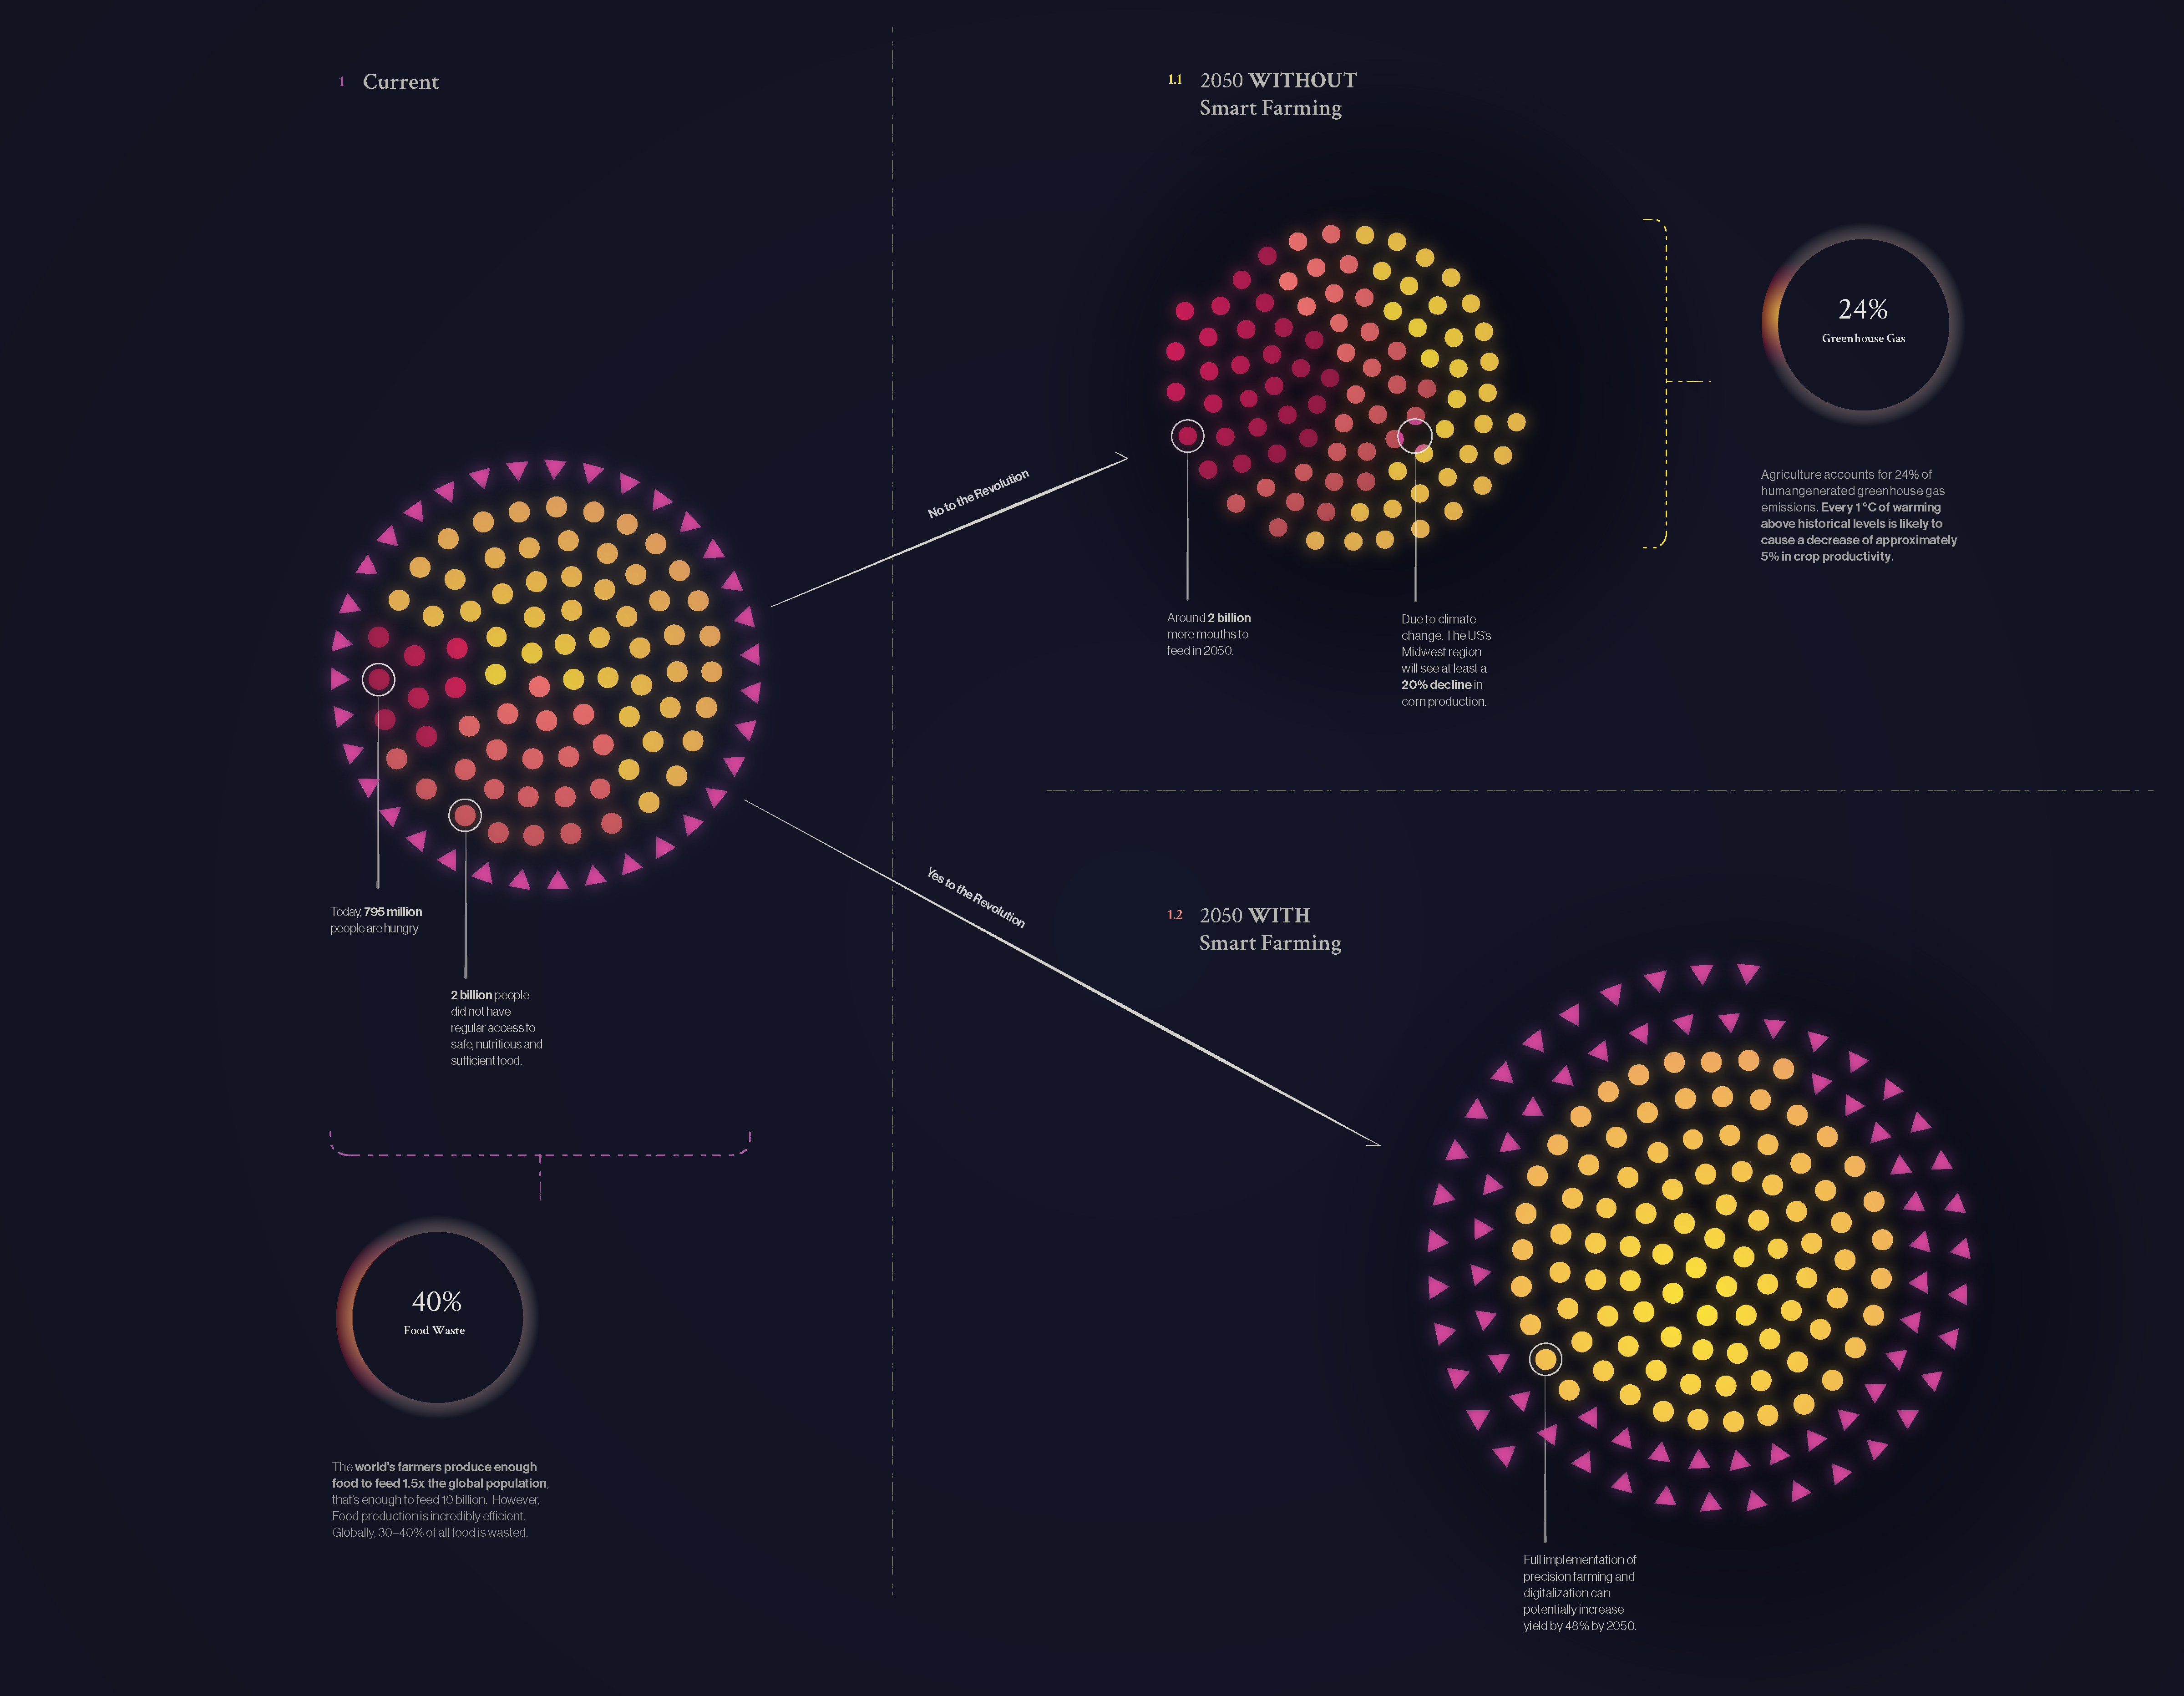
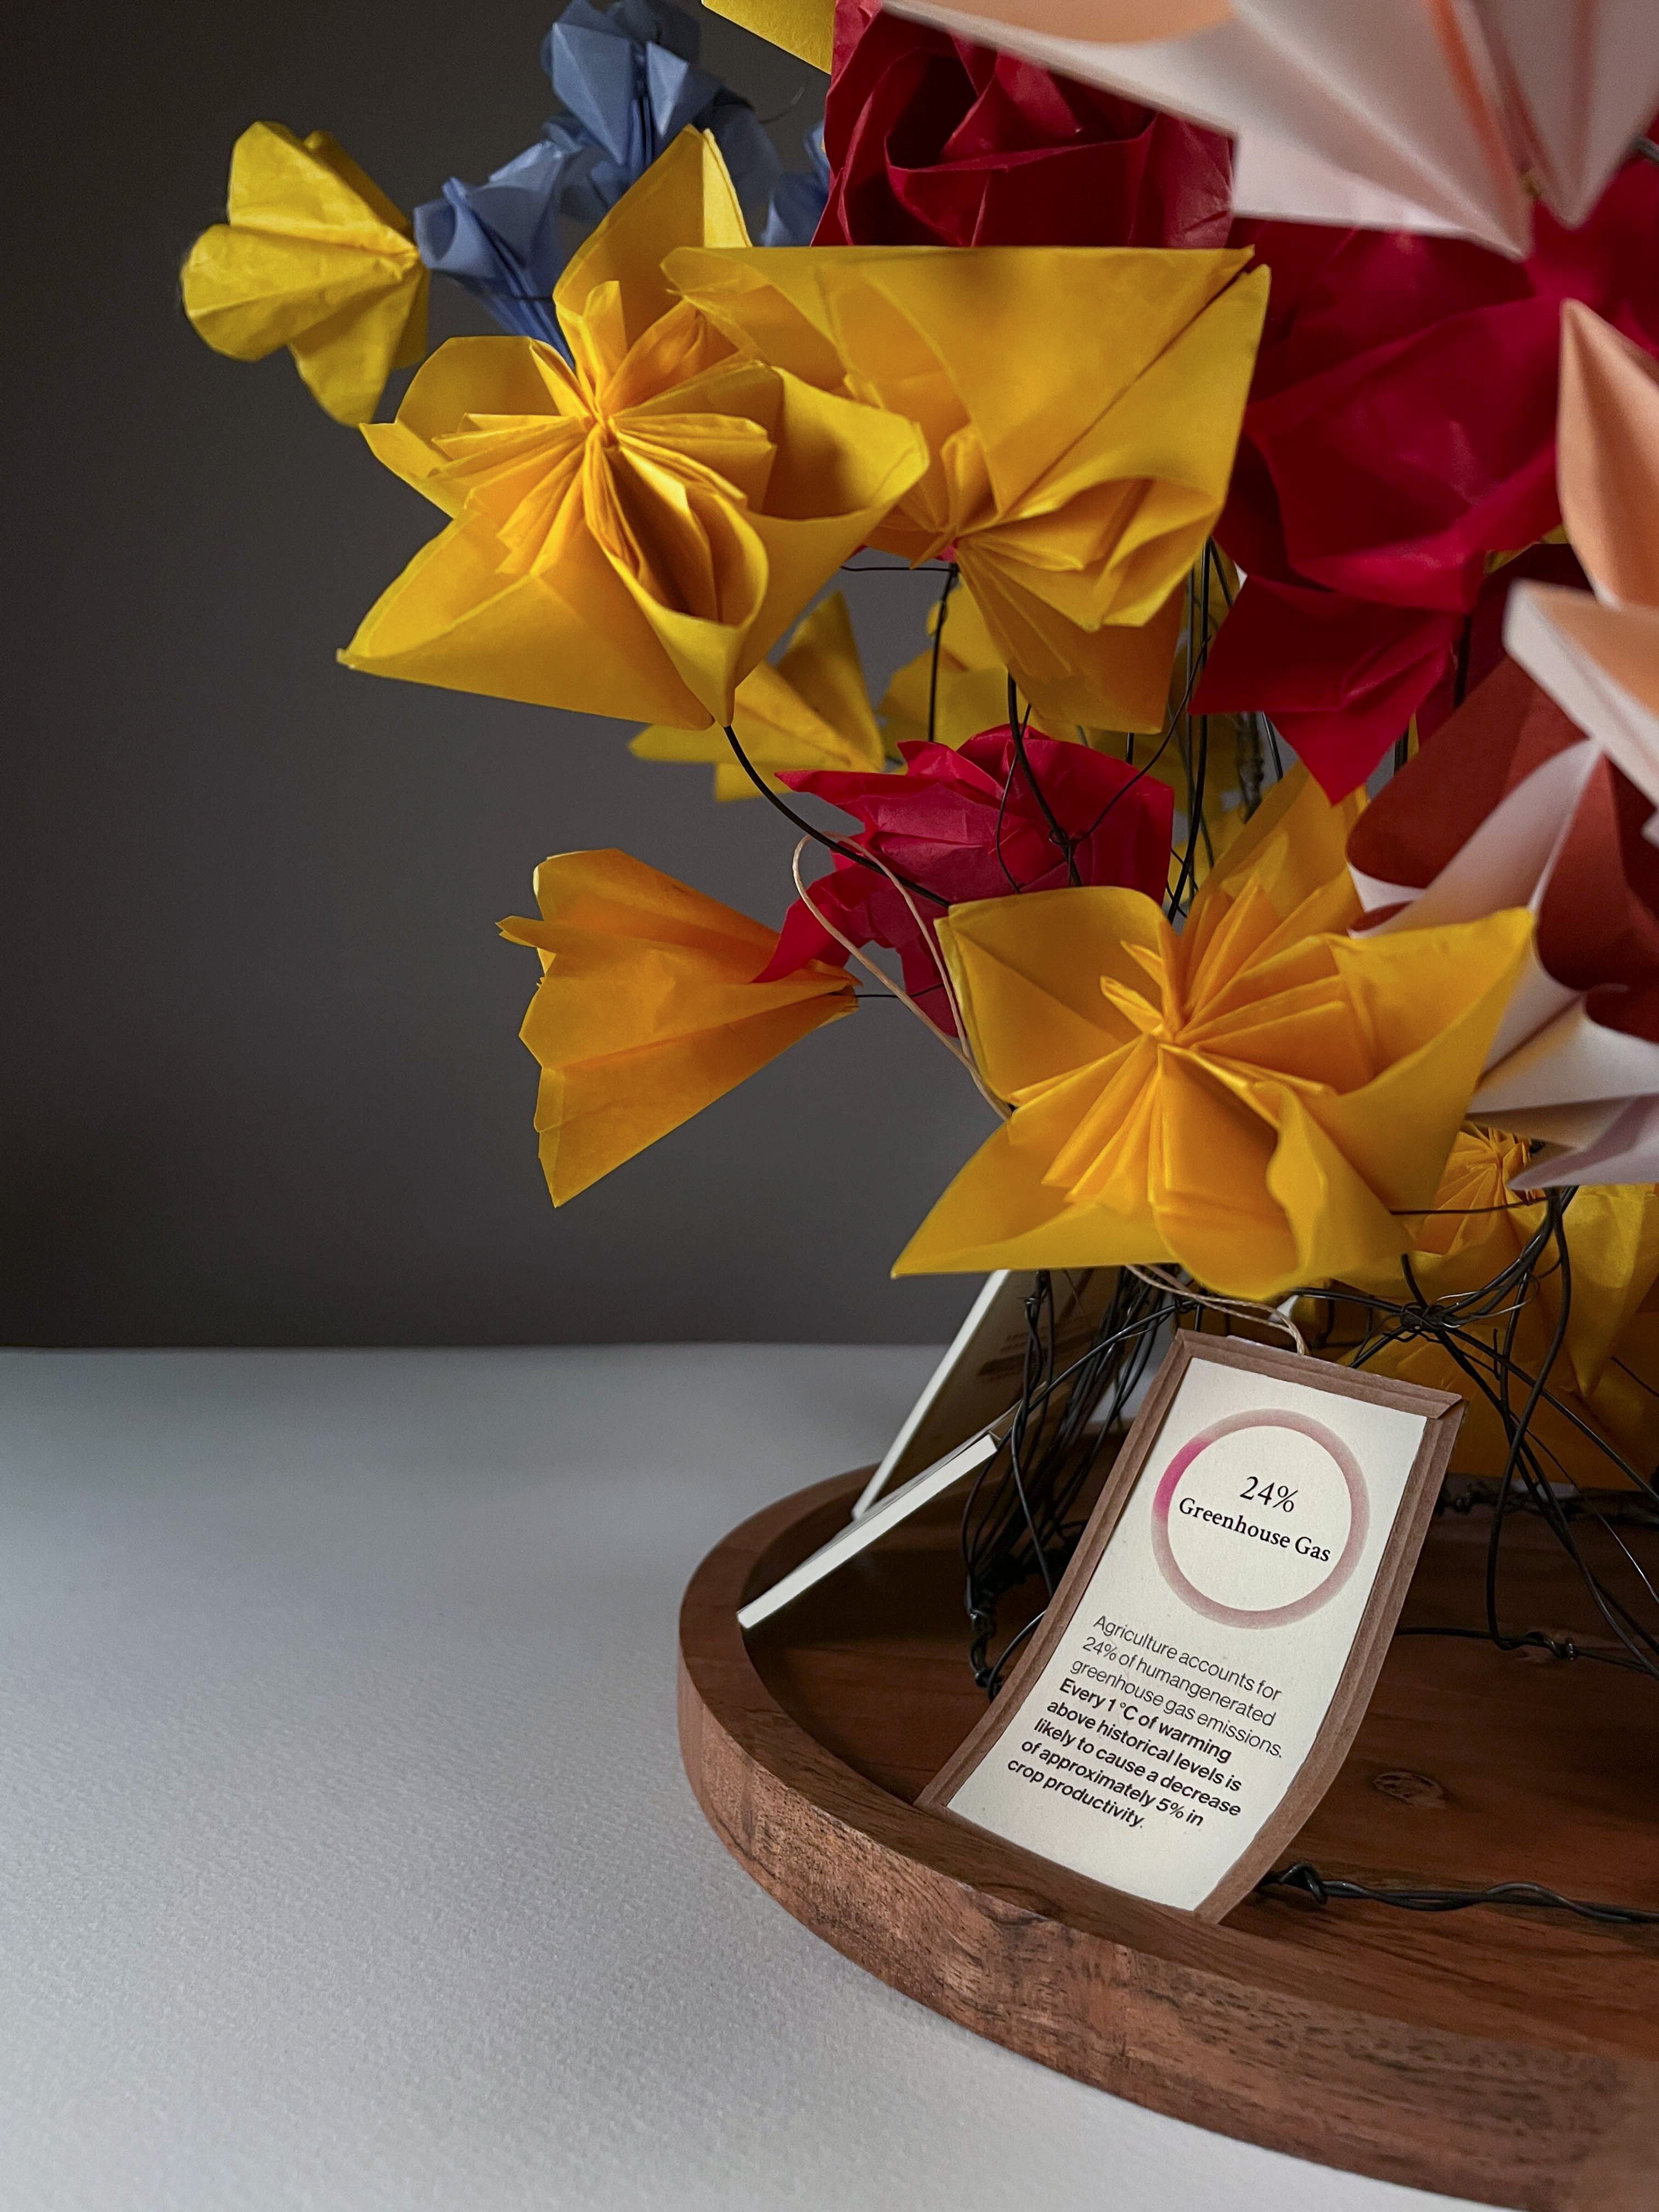
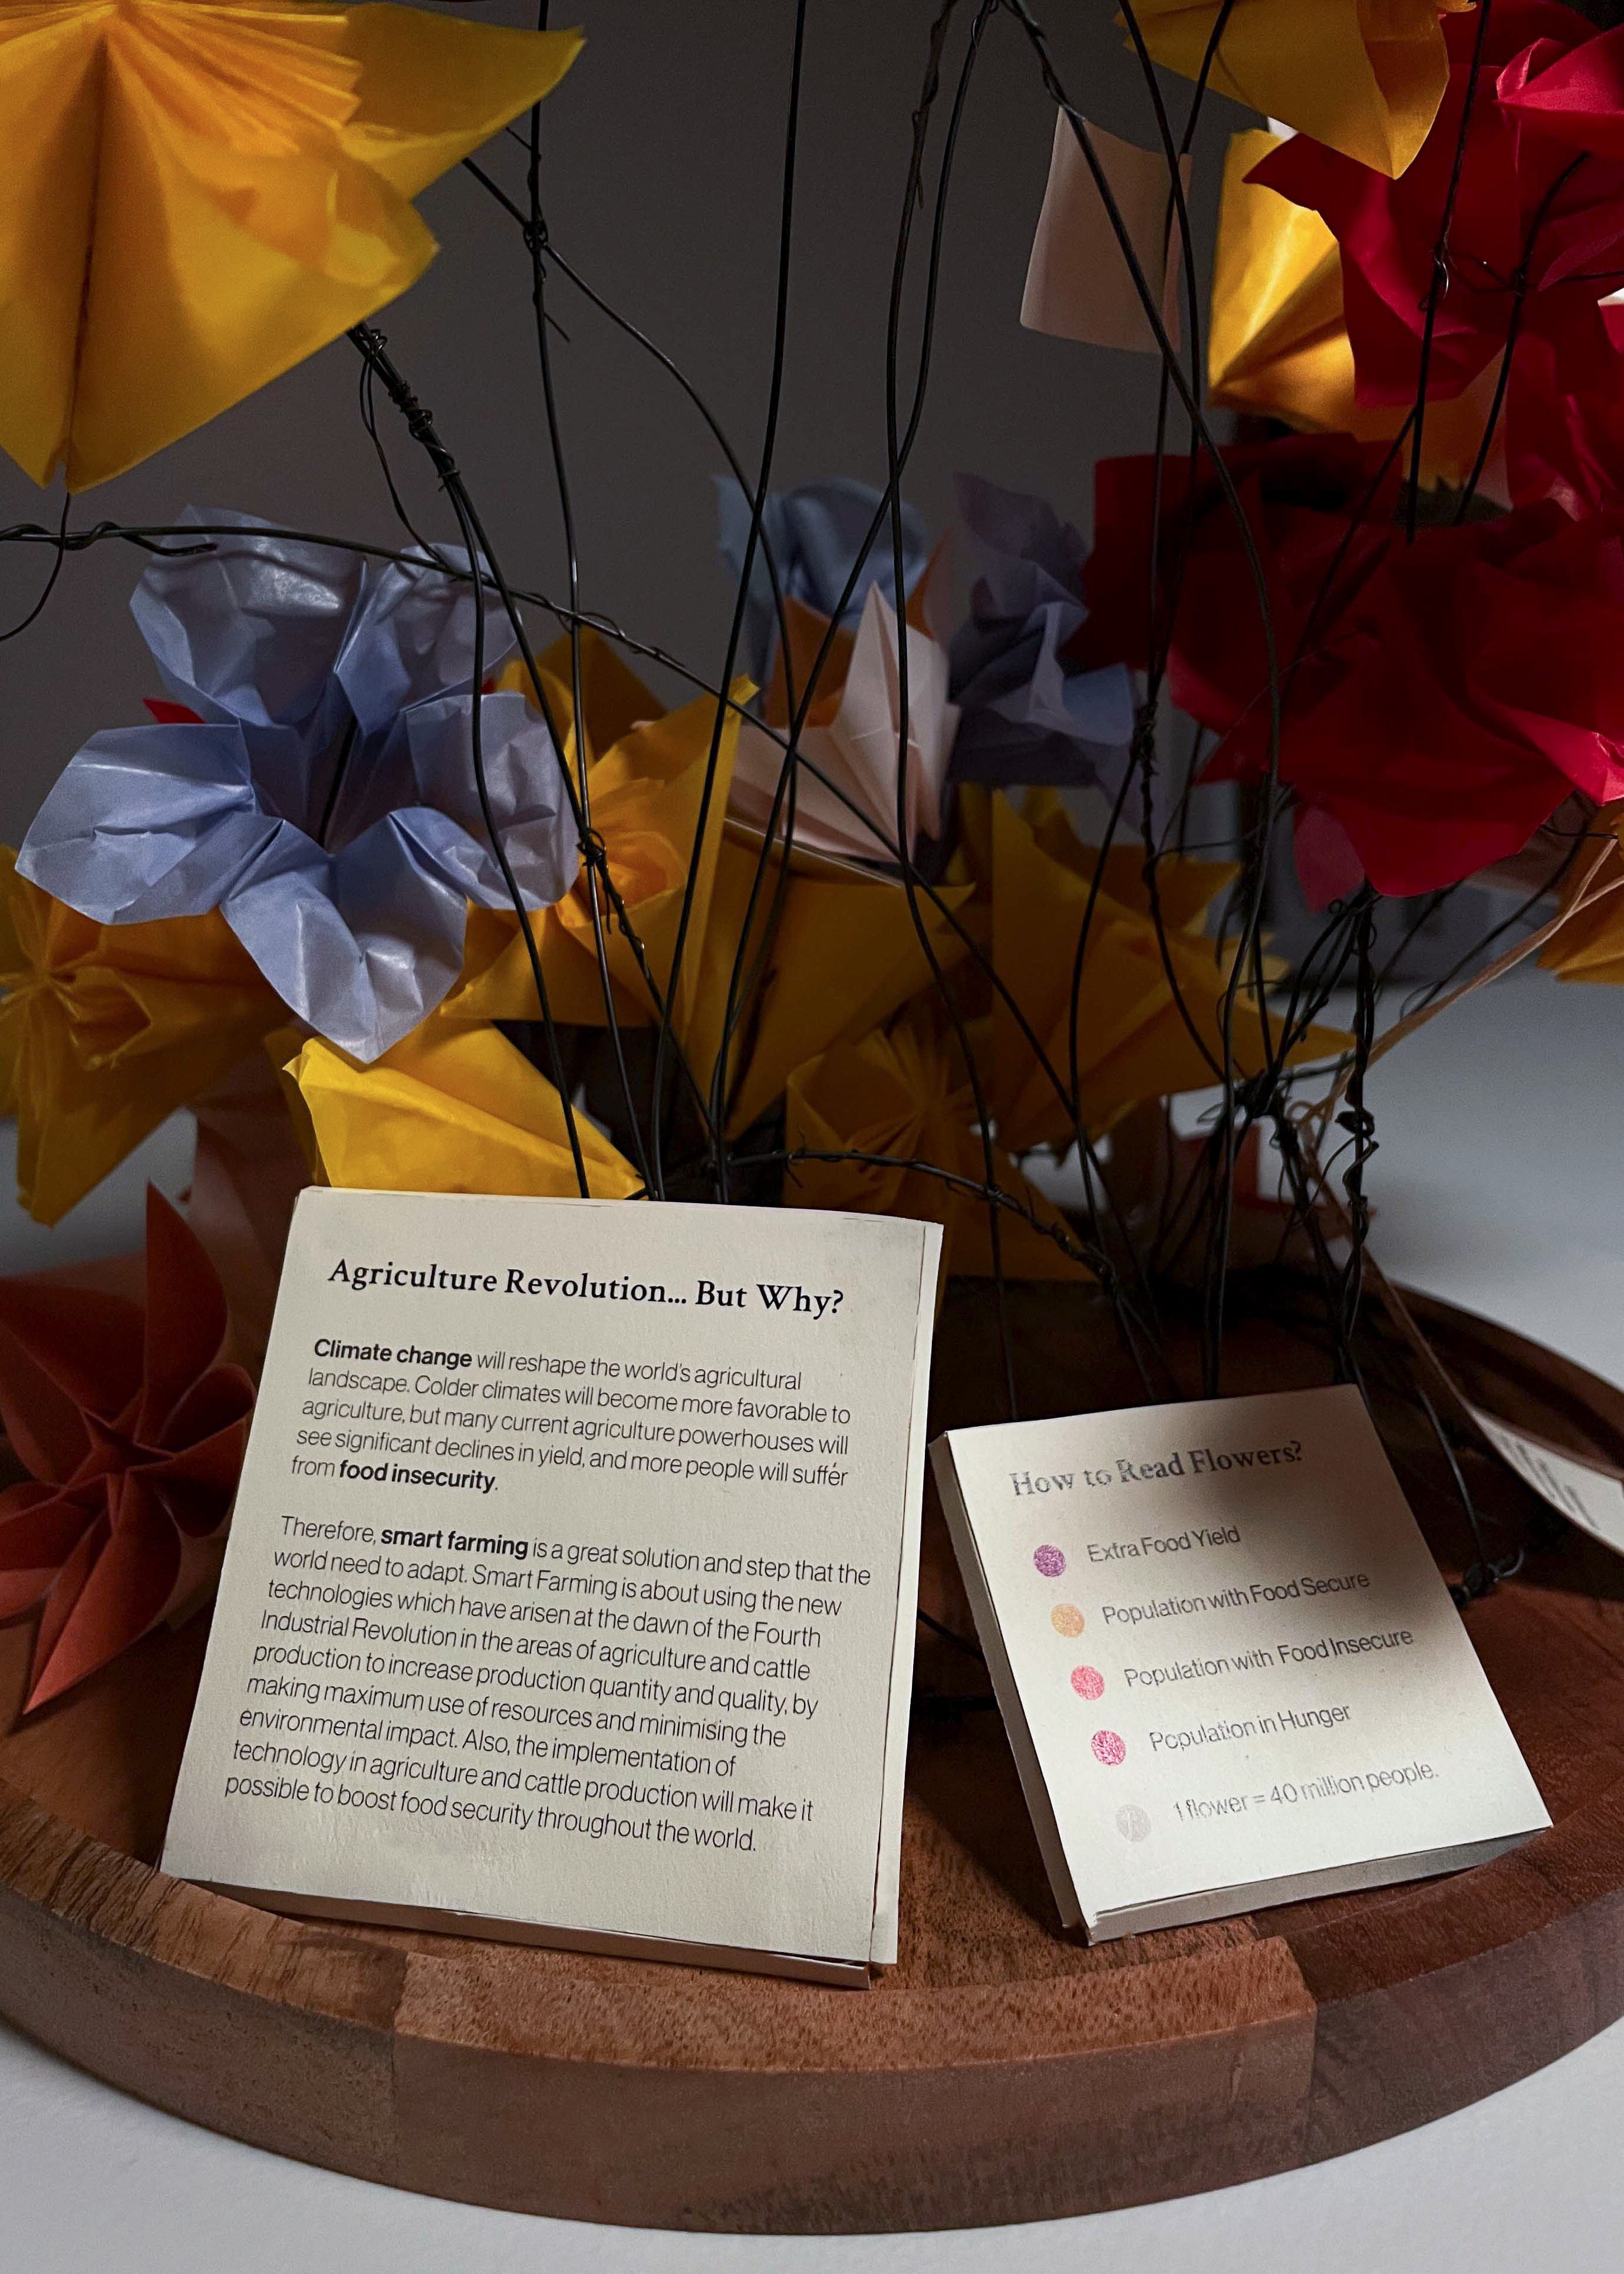
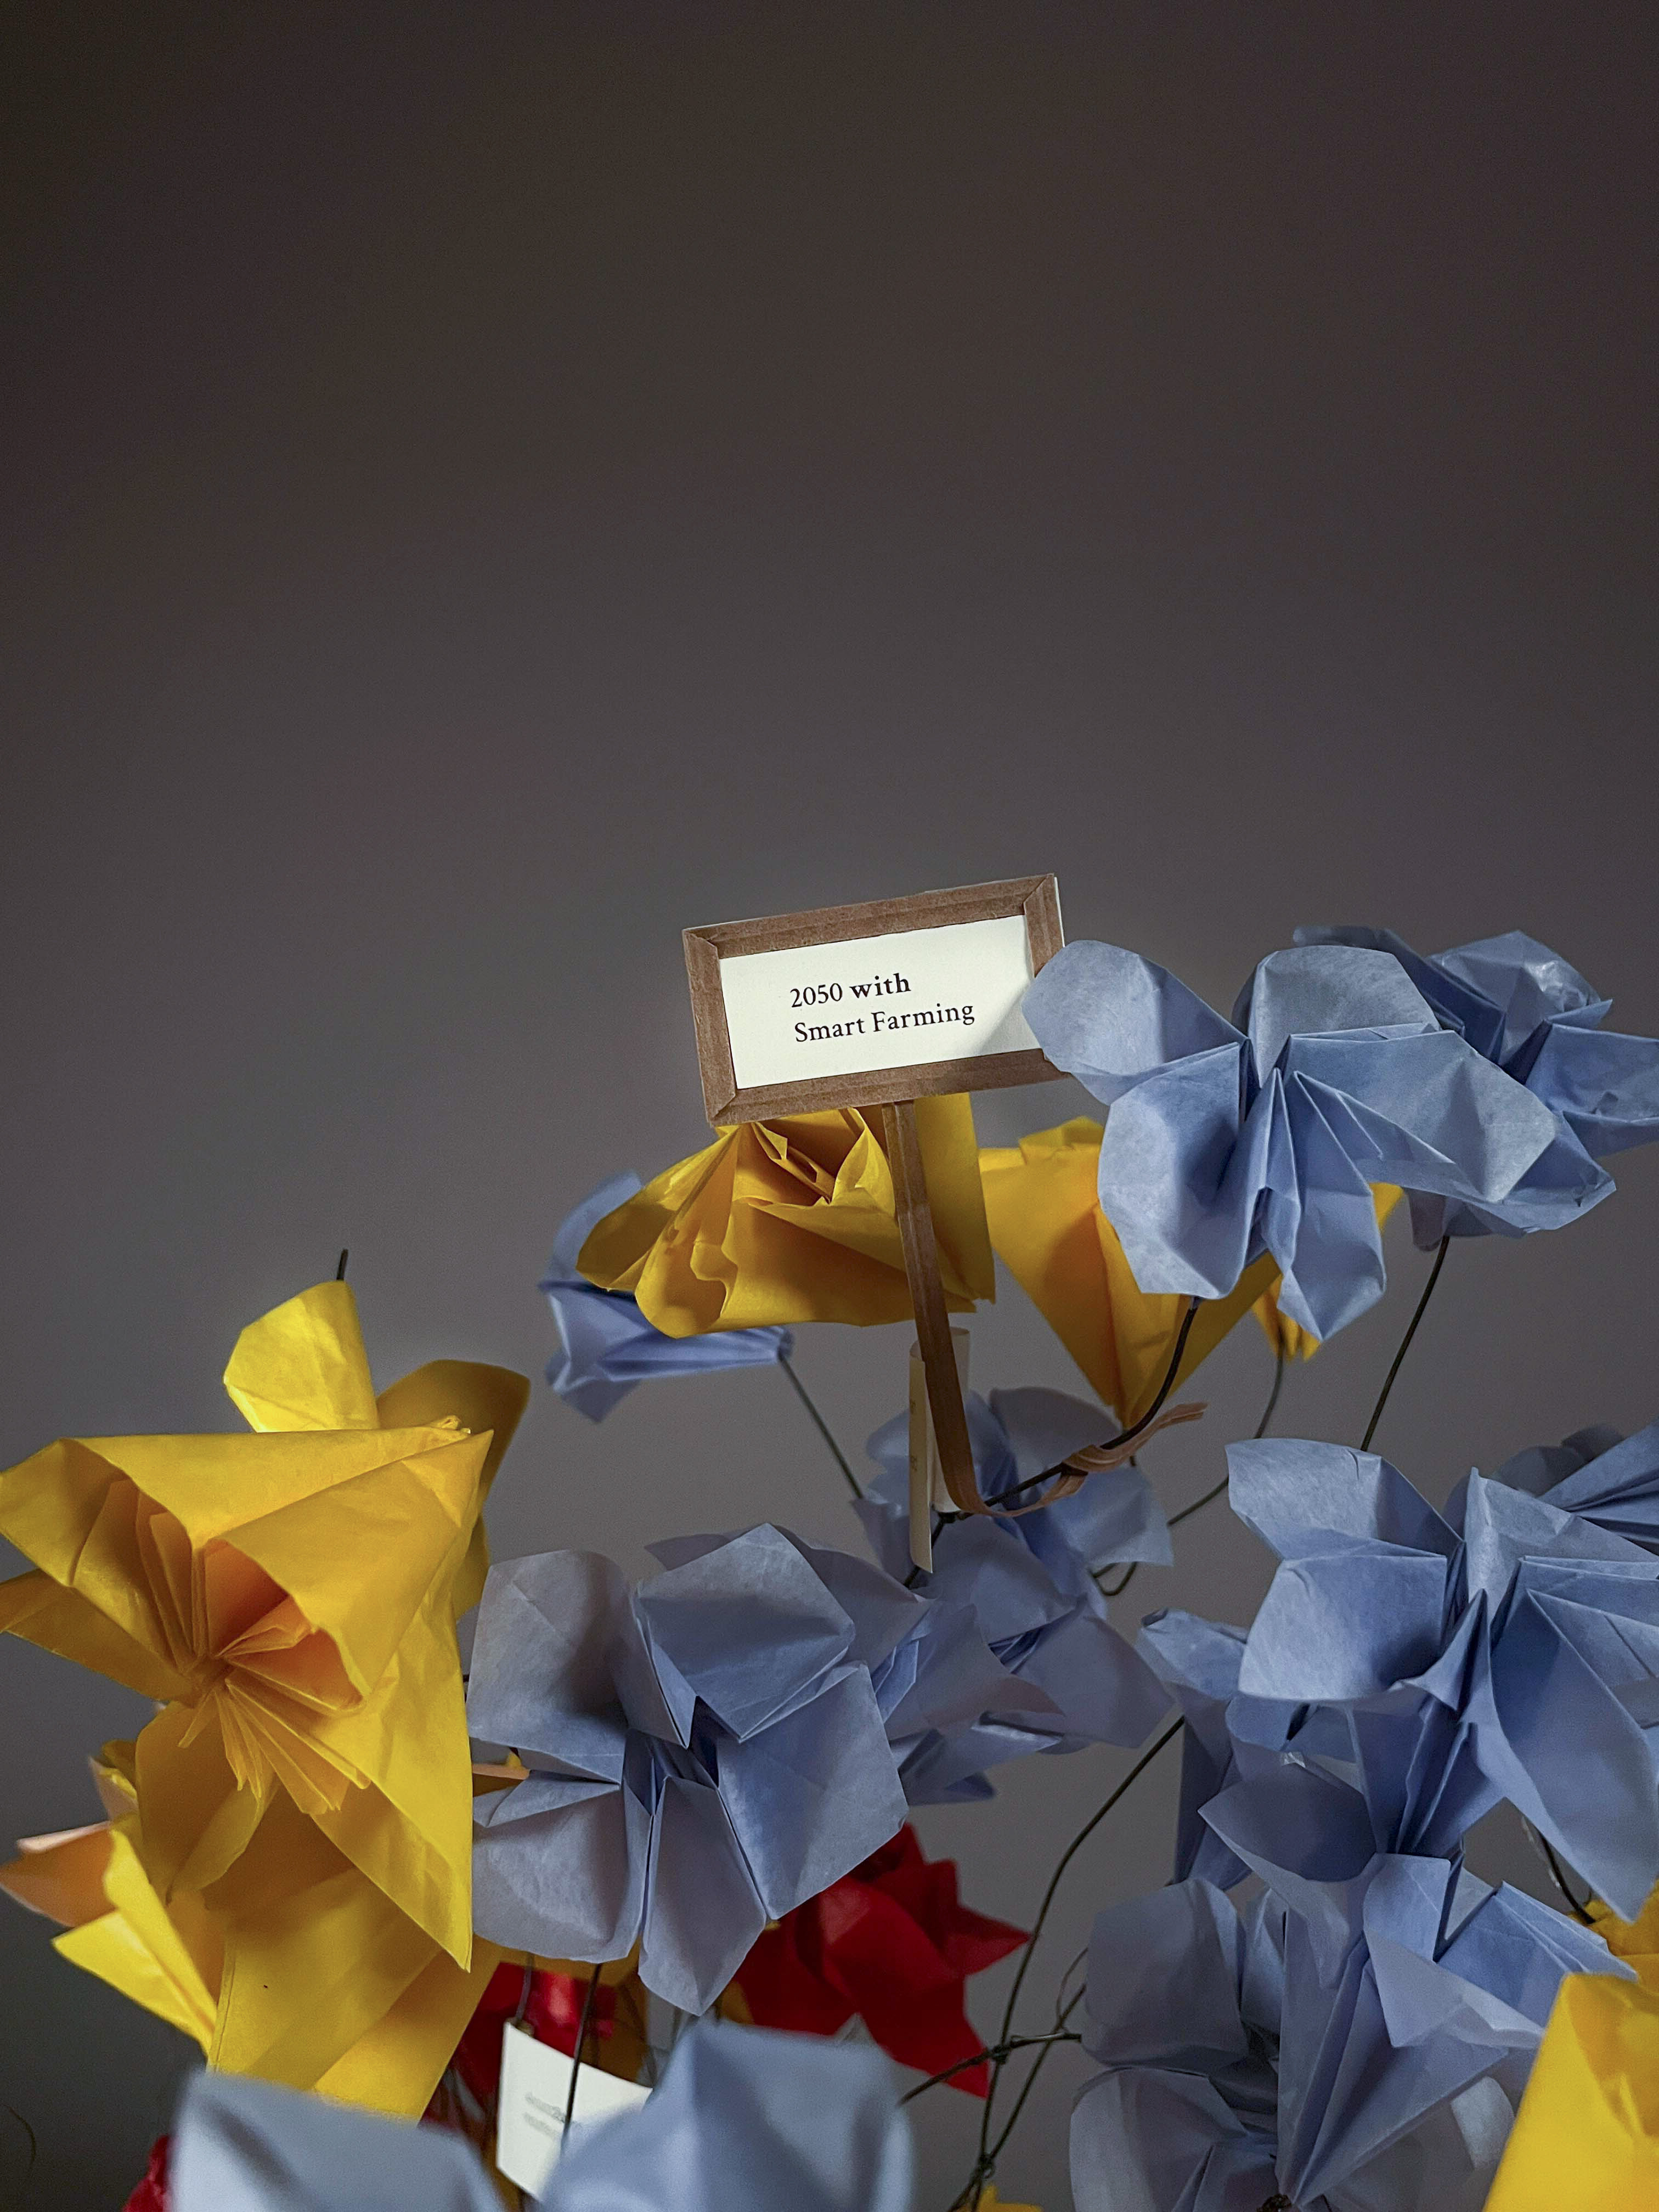
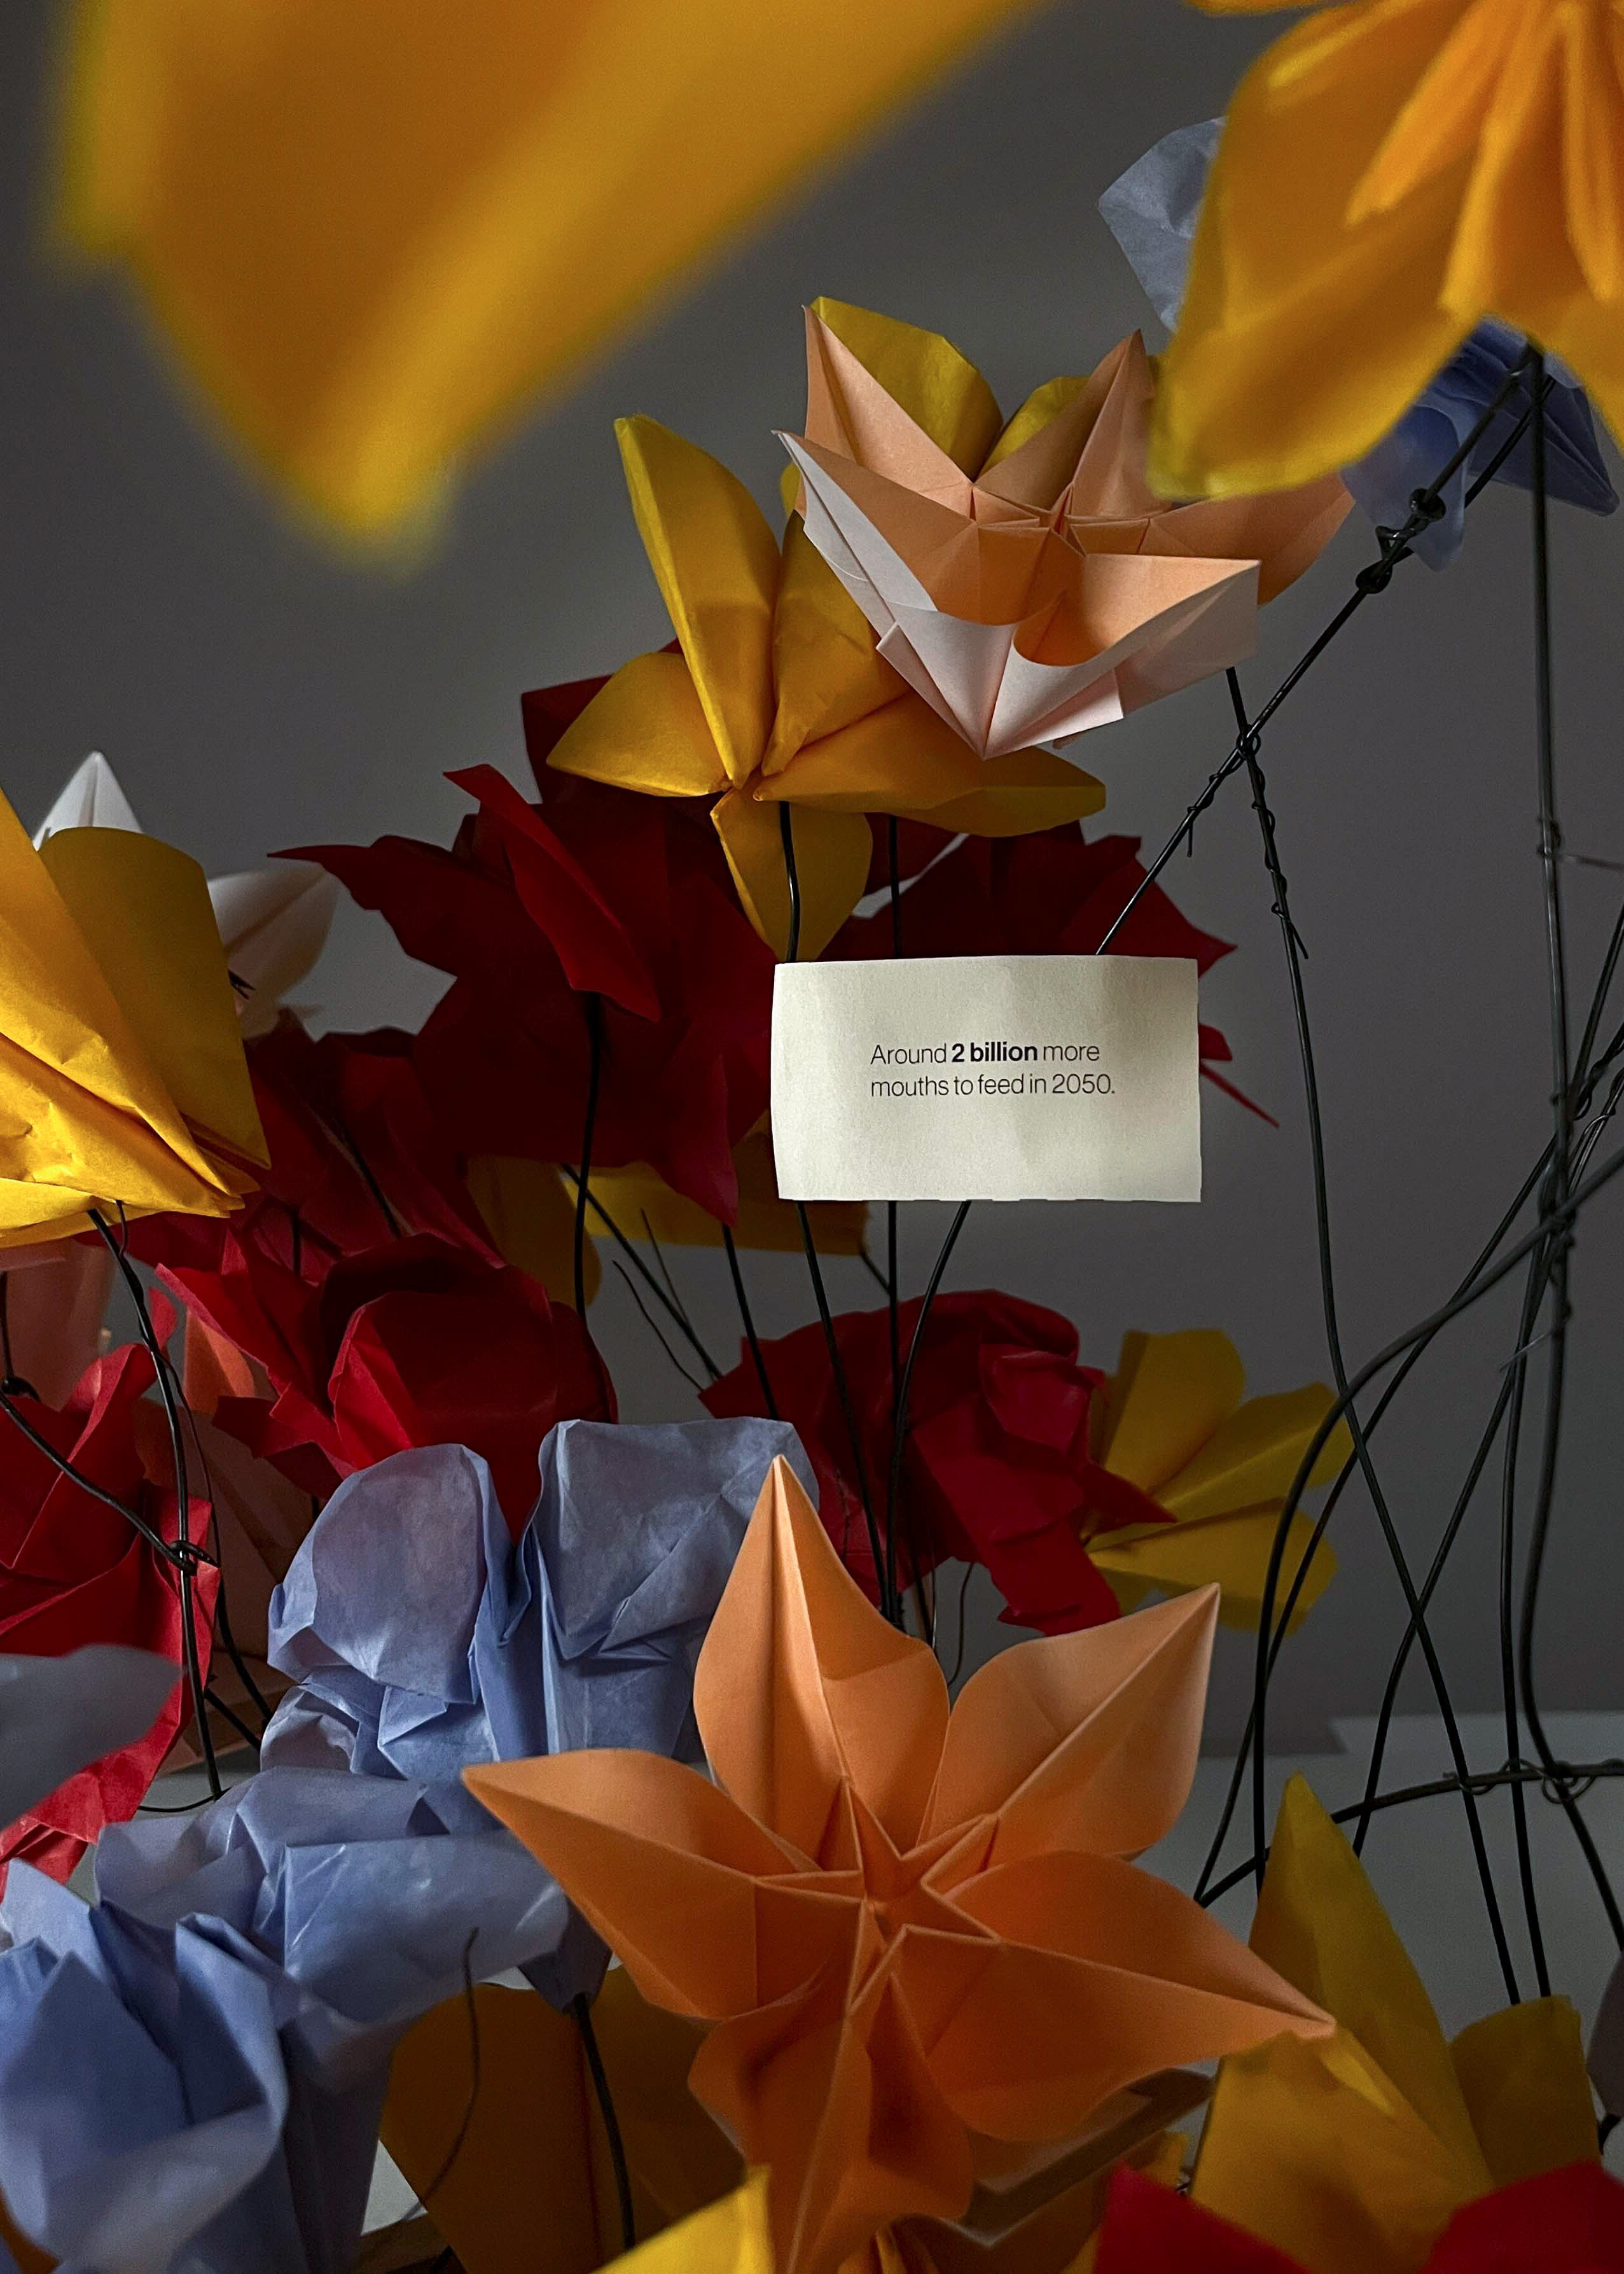
Food Insecure is a severe issue all over the world. Today, there are more than 795 million people are hungry, which is why we need to promote precision farming because it is a more efficient system in terms of production and distribution. Hence, based on the data that I researched, I visualized the data and create a series of designs to show the audience why we need precision agriculture.
I started the whole project by asking myself why and how to help address food insecurity, which eventually led me to precision farming. So, I looked at various studies to find data and information on the topic and took inspiration from the blooming flowers to visualize the data.
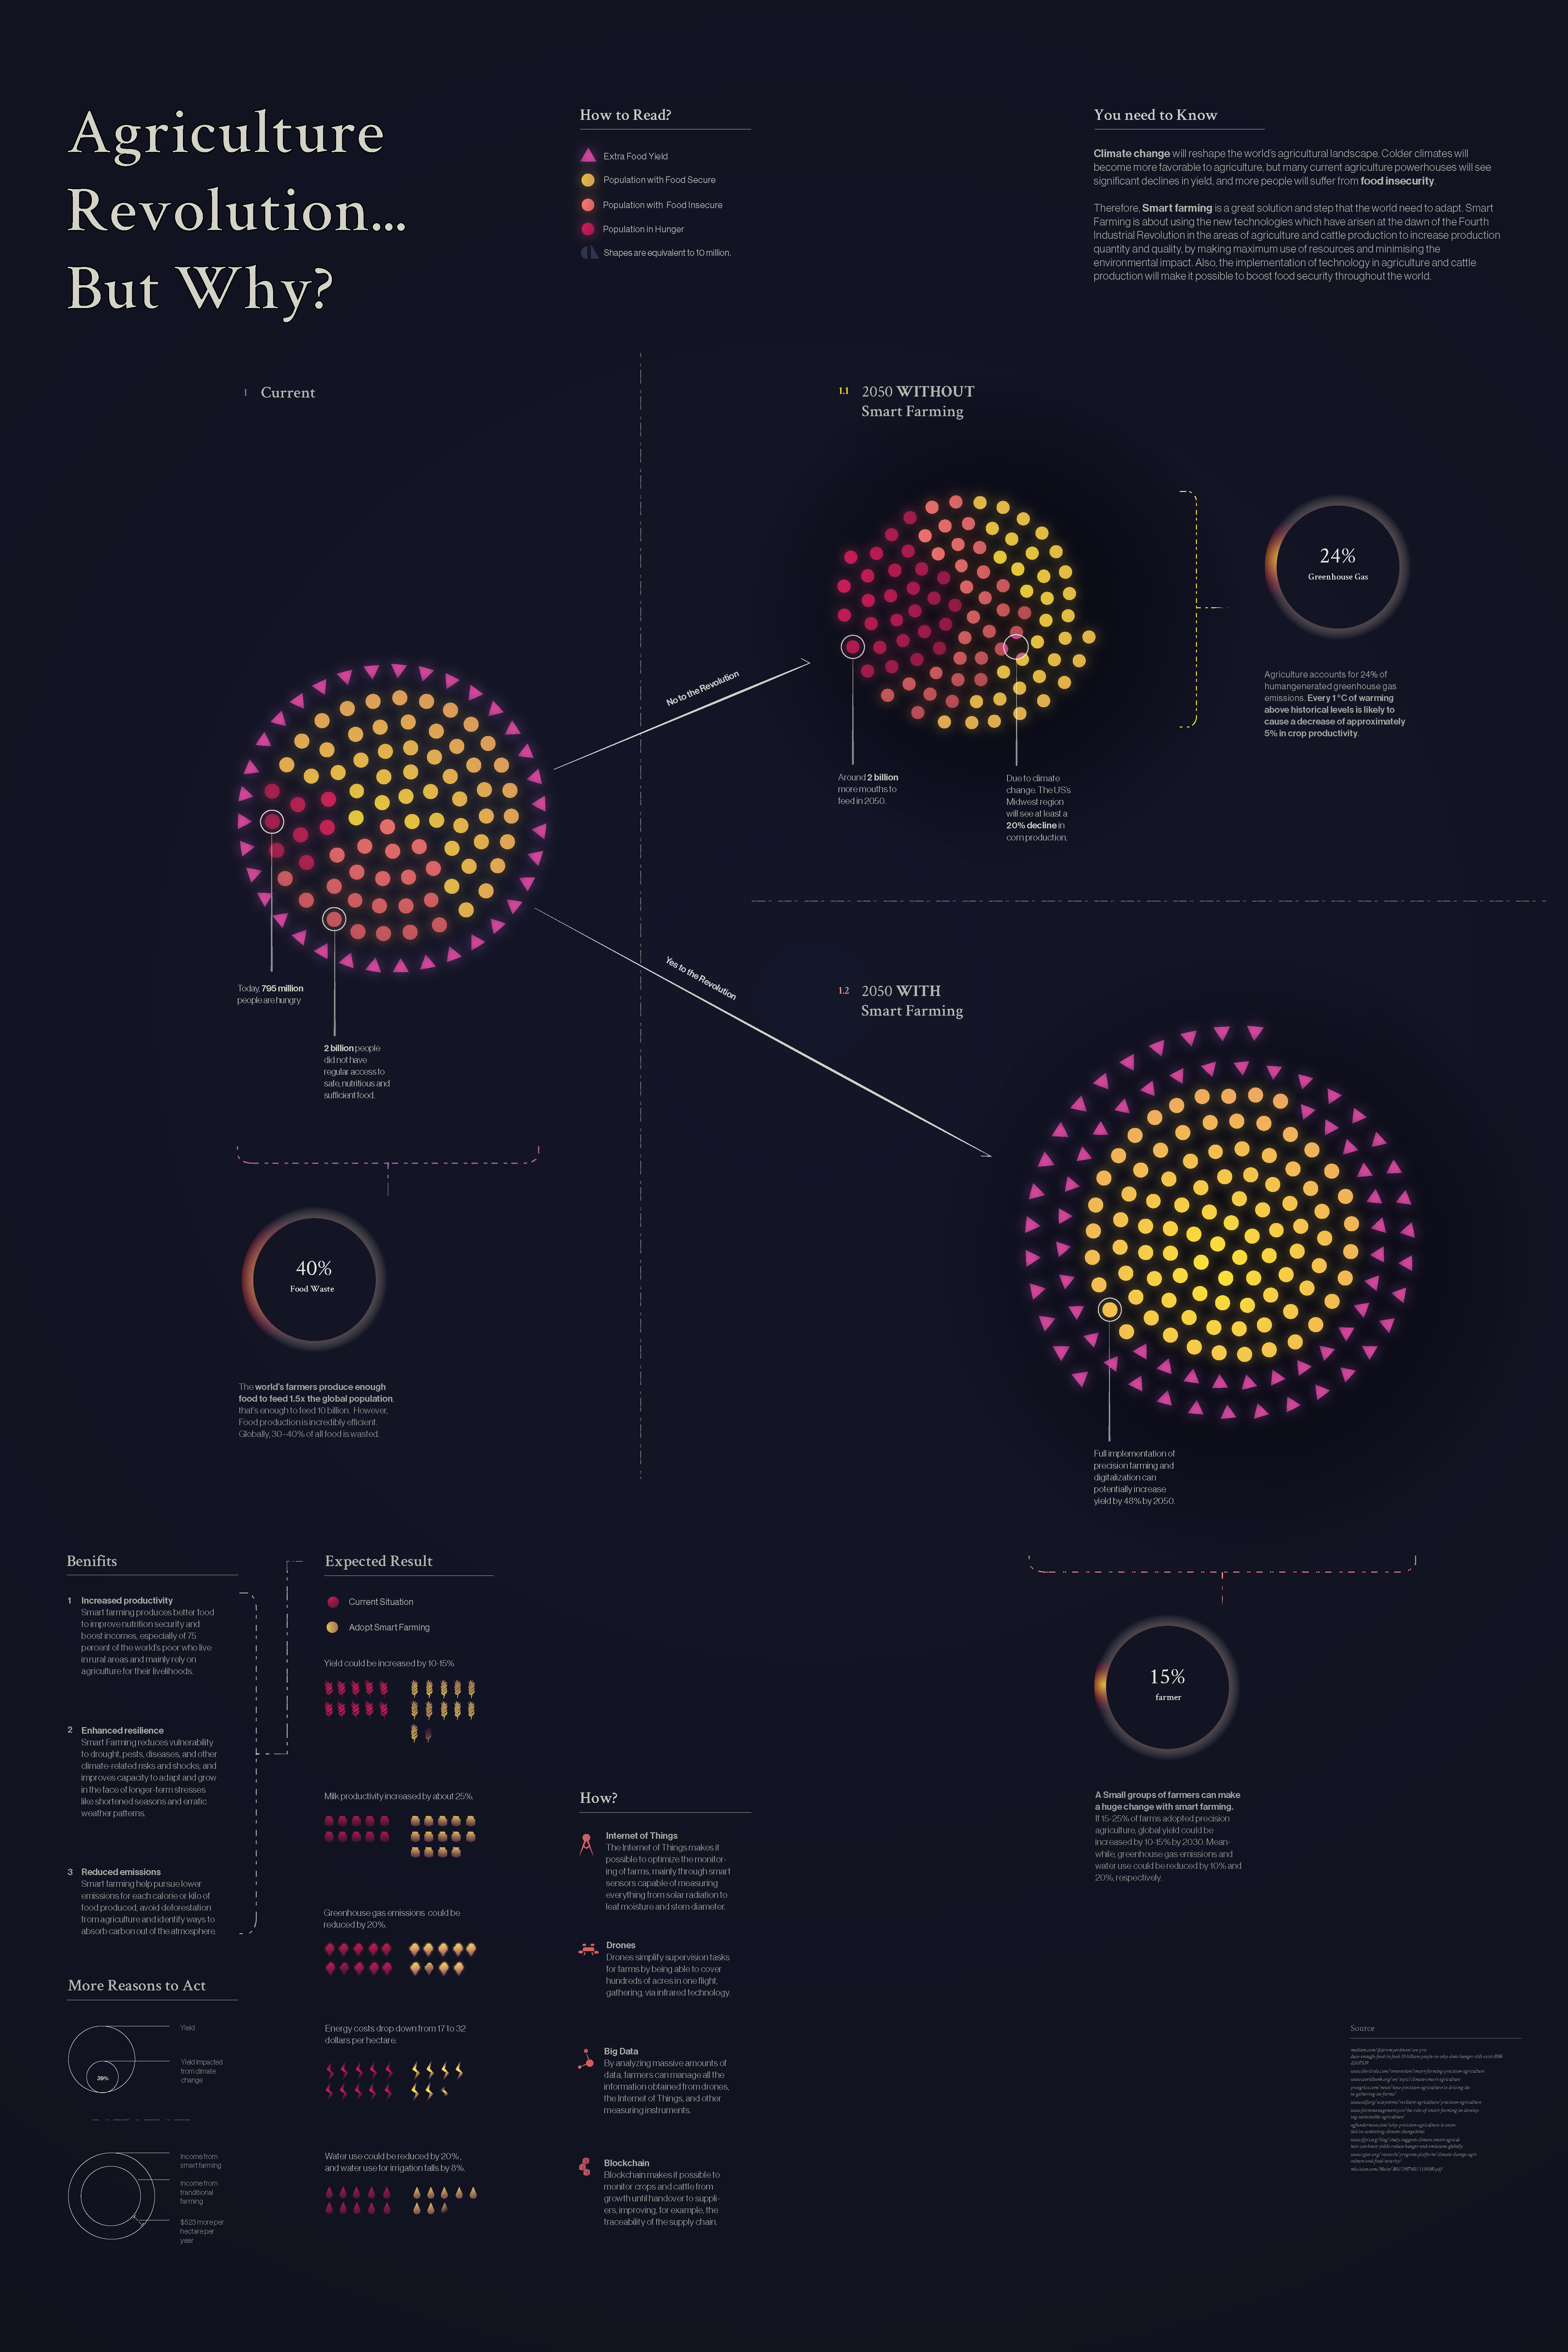
One of the design challenges I faced during the process was finding the right way to showcase people at different levels of food security and food waste on the same graph. Then the problem was resolved simply by using different shapes and colors.
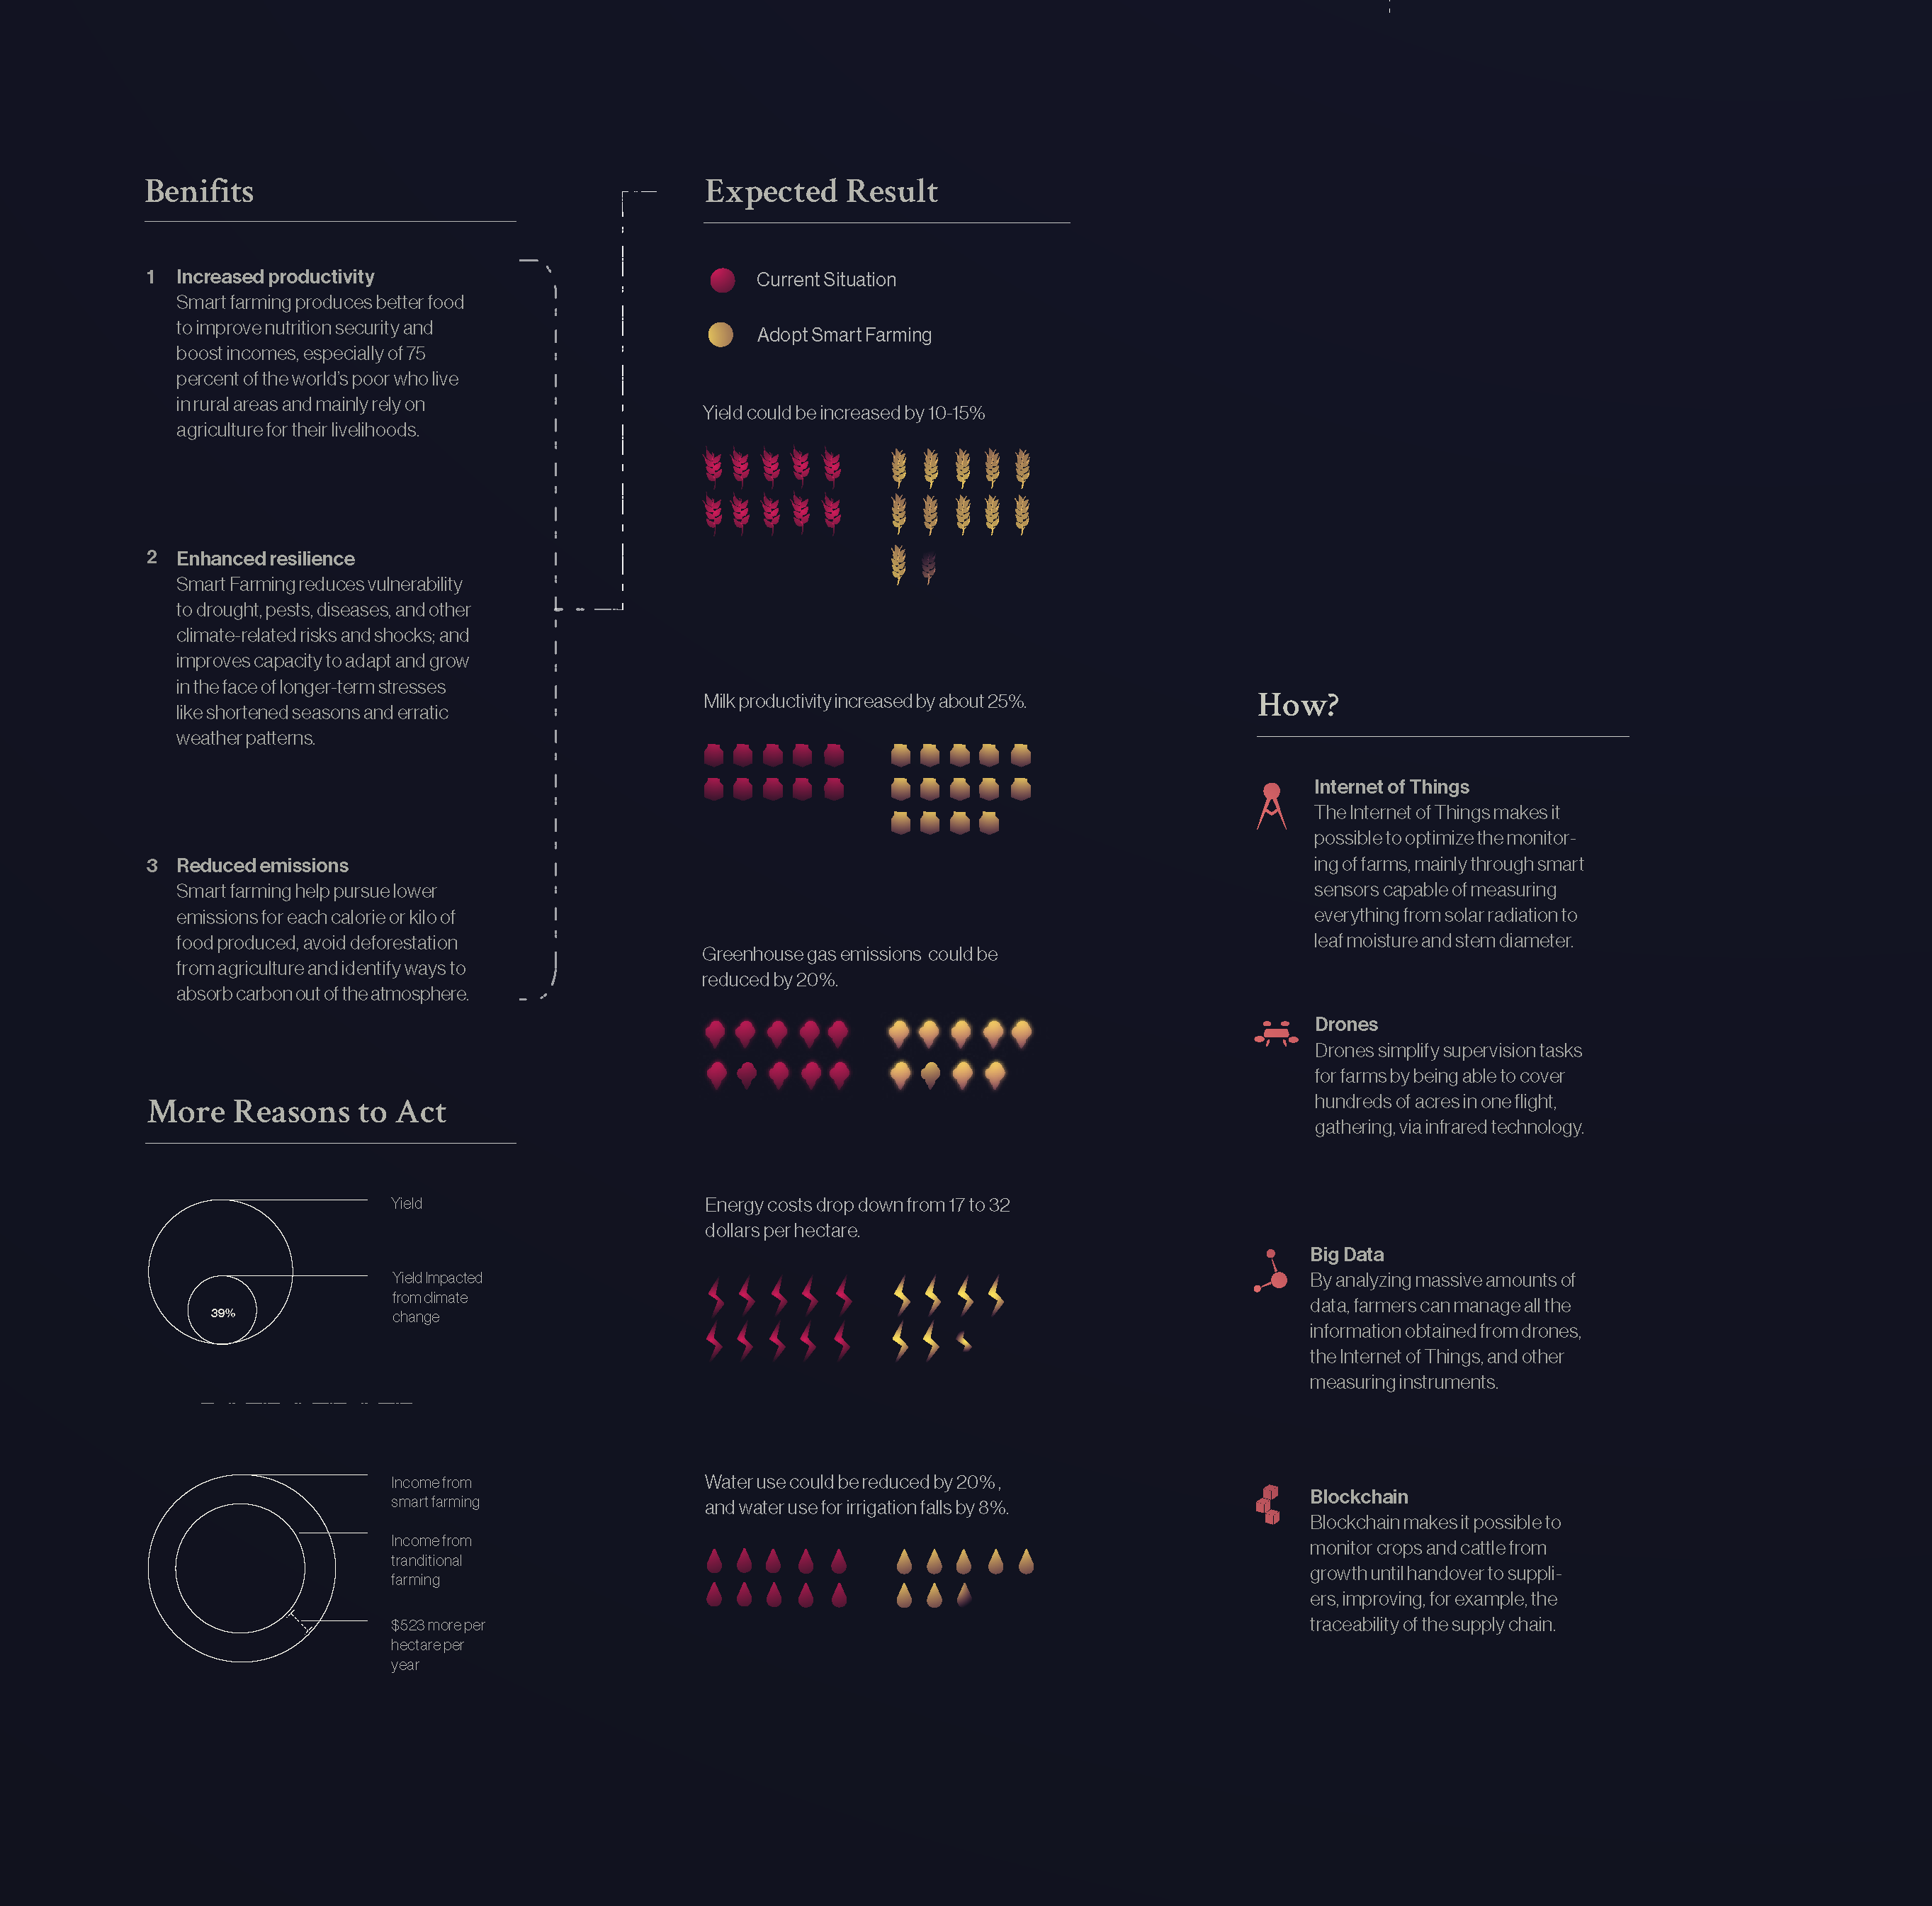
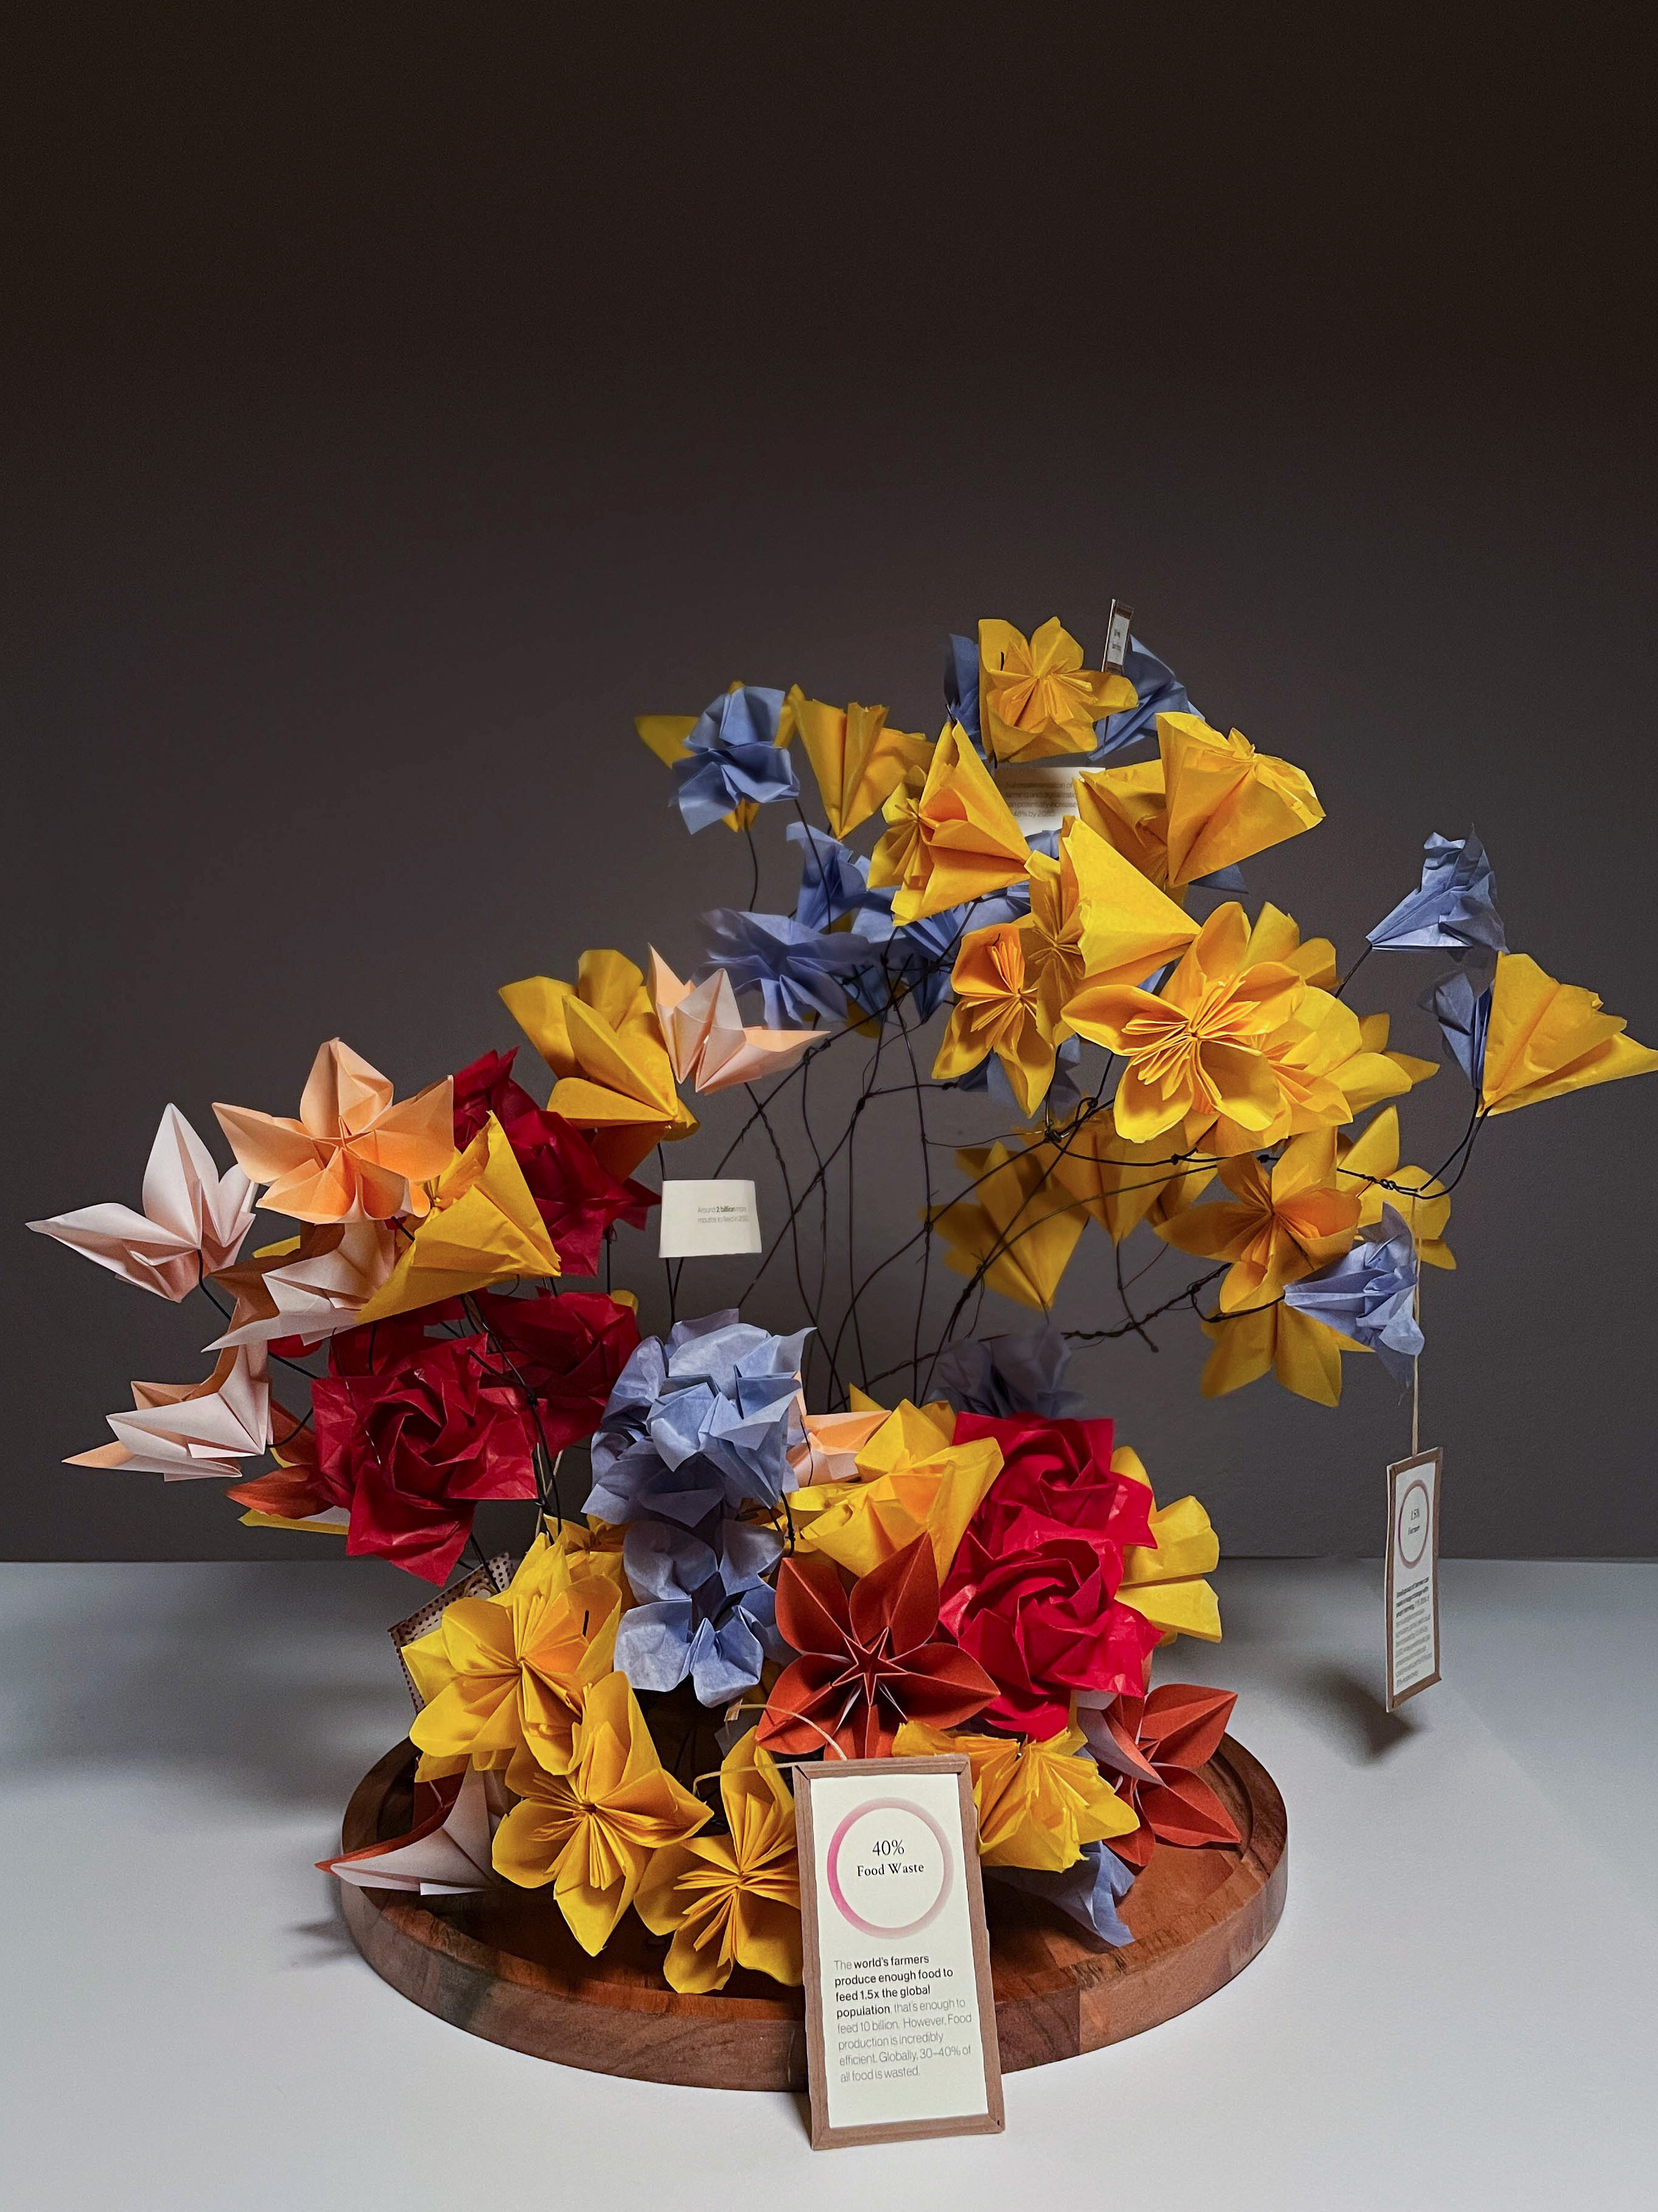
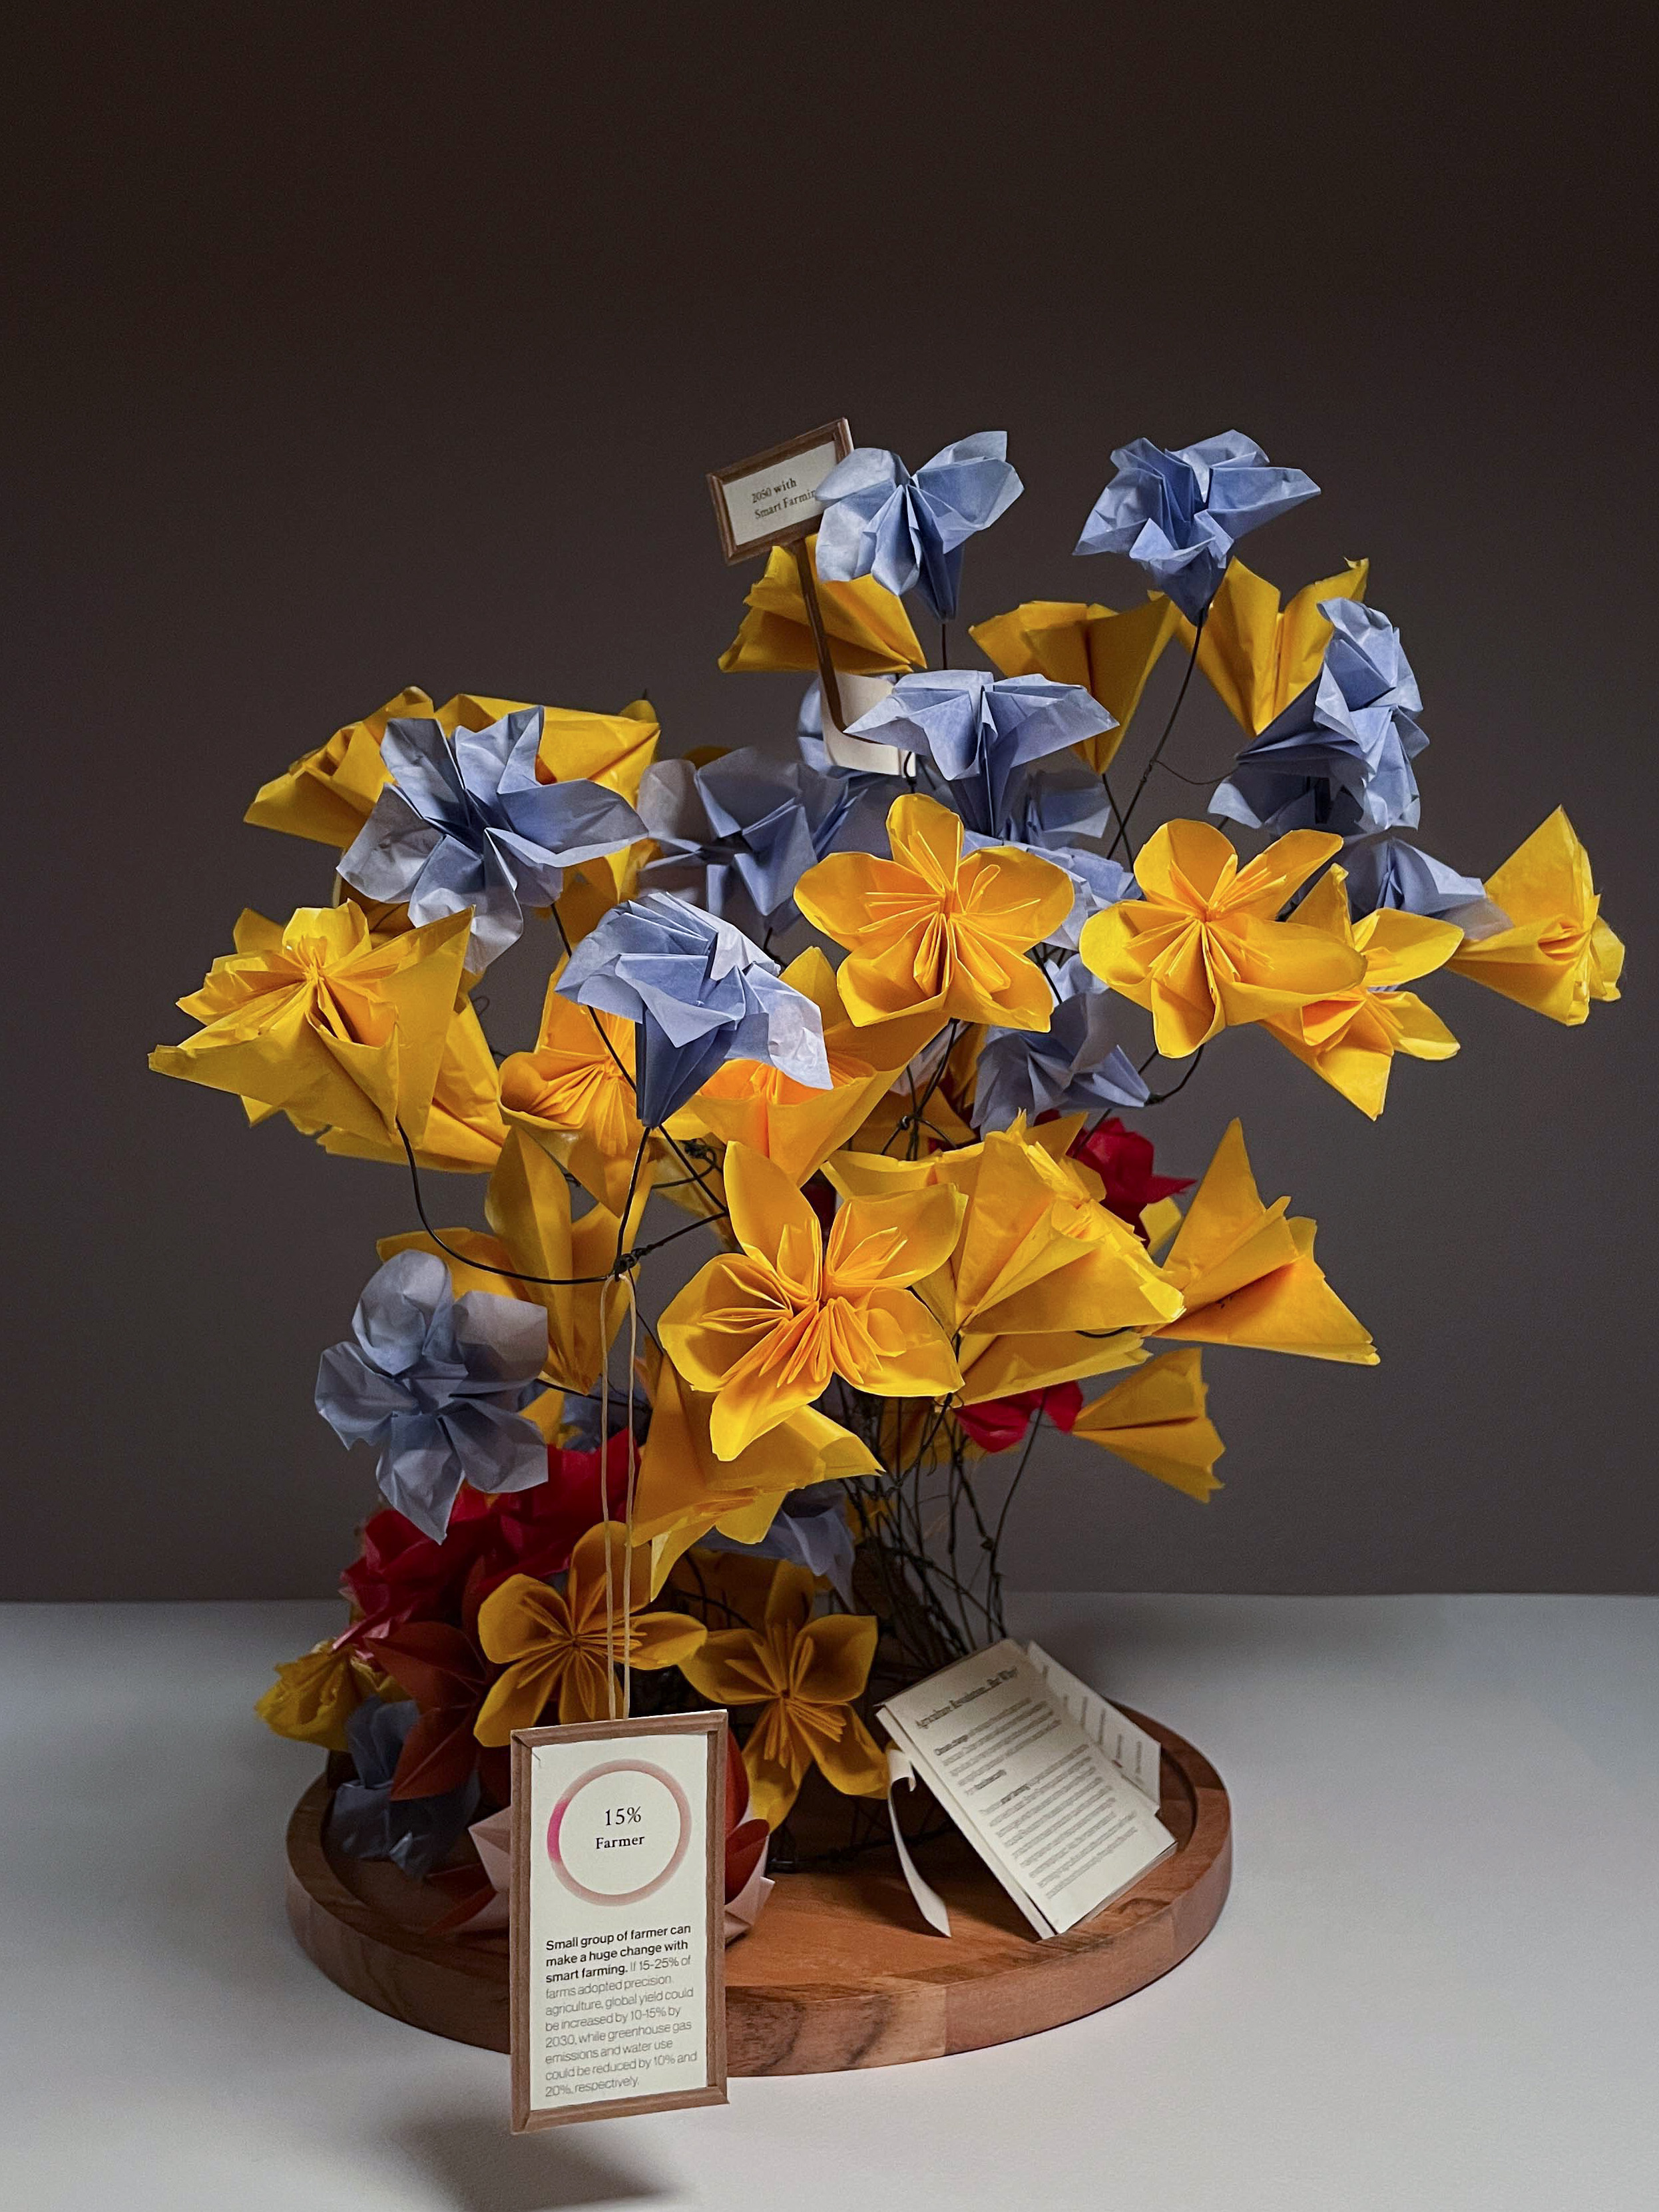
Then I experiment with the potential representation 3D form of the data visualization.
Finally, an animated infographic was created based on previous research, data visualizations, and experiments.